Our high-performance visualisation tool, Spotlyt, has undergone a complete makeover and, after 18 months of continuous development, the new and improved version is now available on our website brytlyt.io.
Significant improvements have been made to the UX of the graphic user interface, adding brand new capabilities in Business Intelligence workflows. This takes the user experience to a new level and allows users flexibility that is not possible with other popular visualisation tools.
The latest updates to Brytlyt 5.0
Exceptional user experience: We collected feedback from users and worked extensively with UX experts to completely transform the interactivity and ease of use of the platform.
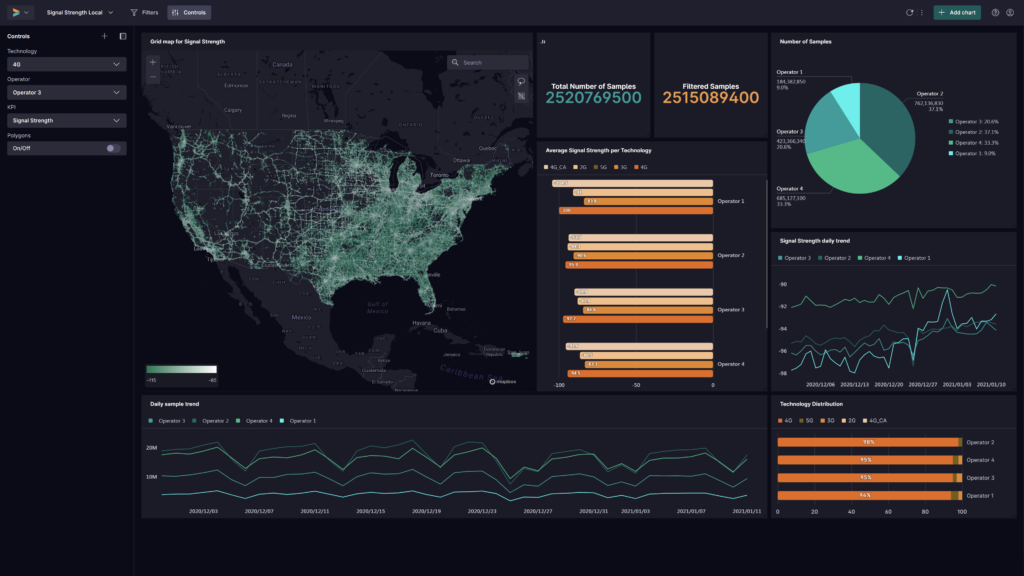
Mapping editor: The mapping editor has experienced the biggest changes. It is now easier to build, edit and navigate interactive charts. In particular, making improvements to visualising different layers of aggregation, so that looking at high level maps or drilling into granular data is seamless and understandable.
Chart creation: Users can draw from the library of charts within the platform. Anything a user wants to create is now possible.
Advanced scripting: Easier to use than before – frontend scripting is one of the most important Brytlyt features. Almost every field may be set not only by creators, drop-downs, and switches but also by a script. Brytlyt 5.0 provides script auto-generators, syntax suggestions, and multiple examples to create highly customised and responsive worksheets easier than ever before.
Data filtering: Important updates have been made to improve how users interact with the data filtering functionality, enabling faster time to insight.
In-app documentation – External documentation is useful, but outdated. In Brytlyt 5.0 users can alt-click any element and see the corresponding documentation fragment inside the application.
Serverless: Our visualisation tool is deployed on a serverless platform. Running in the cloud and easily accessible through a browser log in, users can now benefit from cost-effective, on-demand, and flexible GPU-powered data visualisation.
Augmented data science: We have added, components for deep learning on structured data and the deployment of neural networks, supporting tight MLOps integration. The full version with integrated AI will be publicly available in the next release in 2023.
Speed of Thought Analytics
“Our aim is to empower Speed of Thought Analytics. This means empowering the user experience to be highly intuitive and productive when using our platform. For new and existing users, our developments are always focused on making their journey to meaningful insight as quick and easy as possible.” – Richard Heyns, Founder and CEO of Brytlyt
Brytlyt’s visualisation tool is built for a generation of analysts who want to do more, faster.
By increasing usability and availability of advanced tools, Brytlyt continues to push boundaries and are the world’s fastest and most advanced analytics platform for large and complex data, particularly geospatial workloads. Creating an account at Brytlyt.io gives you all the tools you need to unlock a pathway to data-driven insight.
More exciting updates will be released throughout 2023 so follow us on social channels to learn more.
